Author Archives: William Freedberg

About William Freedberg

Studies indicate that Will Freedberg occupies the ecological niche of a semi-nocturnal generalist. His habits change seasonally, doing fieldwork and bird surveys in the summer, but also blogging, coordinating volunteers, taking photos, and doing background research. Life history traits include growing up in Boston and reluctantly graduating from Yale College. Behavioral research shows that William occasionally migrates to the tropics to seek out Hoatzins, pangolins, and sloths, but mostly socializes with his age cohort in urbanized areas of eastern North America. He is short-sighted, slow to react, and a poor swimmer.

Field Notes from the Quabbin: Moose Mamas and Magnolia Warblers

A Magnolia Warbler perches in a shrub. Photo by William Freedberg

A late-June morning at the Quabbin Reservoir:  Winter Wren songs echo from hollows and wetland thickets. Blackburnian Warblers whisper their buzzy, quiet notes from the canopy. Blue-headed Vireos squeak and argue over perches in spruce trees. These birds, like many species that prefer conifers or highland forests, are rarely seen outside of migration in eastern Massachusetts. At the Quabbin, it’s hard to miss them.

In the background there’s a constant clamor from the Quabbin’s most vocal and abundant woodland breeders: Red-eyed Vireos, Veeries, Ovenbirds, and Scarlet Tanagers.

Amid the birdsong, there’s the faint scratching of my pencil and clipboard. Point 4, Minute 1 // Scarlet Tanager. Male. Calling. 19 meters // Ovenbird. Unknown sex. Singing. 33 meters.  The birds are a thick during dawn chorus, and between recording each species, sex, behavior, and distance from me, it’s hard to keep up. The survey period passes quickly, and it’s time to hike to the next count site.

The data we collected that morning will eventually be used by the National Ecological Observatory Network (NEON), an organization which studies large-scale environmental change at over 70 sites across the US, and which partners with Mass Audubon to collect bird data in New England. Normally, it takes just one person to run bird surveys—but recent security concerns at the Quabbin mean that all field technicians are now accompanied by a NEON escort to drive around restricted-access roads.

My field escort that day was Jamie, a soft-spoken botanist who had just moved to New England from Appalachia. When he mentioned he hoped to see his first moose in the Quabbin, I thought it was a farfetched idea, not knowing that around 100 moose make their year-round homes there. As if to prove a point, a cow moose stepped into the road later that day as we were on our way out.

A blurry, through-the-windshield photo of the moose that wouldn’t move.

We paused before inching the car towards the moose. The moose paused, too, and took several deliberate paces towards us. We noticed a smaller second pair of ears protruding from the roadside vegetation, and realized the moose was putting itself between us and its calf. That was our cue to put the car in reverse and give it some room; we would have to wait it out if we wanted to get to our destination safely.

Rolling down the windows, we were surprised to hear a singing Magnolia Warbler, a rare breeder for Central Massachusetts. The banana-yellow male flew across the road, giving us excellent looks at his black mask and bold stripes. I broke out a granola bar and Jamie unwrapped his lunch as we watched the moose feed and listened to the warblers. The mammoth ungulate in our way eventually ambled off, but we were in no rush to leave: life at the Quabbin was good.

America’s Biggest Ecological Monitoring Project

This summer, I’ve been surveying birds at the Quabbin Reservoir for Mass Audubon and NEON, the National Ecological Observatory Network. The deep forests and hollows of the Quabbin watershed host scarce breeders like Cerulean and Canada Warbler, along with most common woodland breeders in the state. The Quabbin’s size and diversity of intact habitats make it an ideal study site for a program like NEON.

NEON is an exciting project because of its scale. Funded by the National Science Foundation, the network comprises more than 80 sites across the country’s 20 ecoregions. At each site, NEON coordinates teams of scientists to keep tabs on a variety of ecological indicators. These include large-scale factors like water chemistry, greenhouse gasses, and tree cover, as well as narrower topics like fish DNA, bird diversity, and disease prevalence in ticks, mice and mosquitoes.

A Scarlet Tanager with insect prey, perched on a snag by the Quabbin. Photo by Will Freedberg.


NEON treats birds as one piece of a vast puzzle: by studying how long-term ecological trends line up with each other, the project aims to parse out the causes and consequences of environmental change.

Most importantly, all NEON data is free and publicly available. It’s fun to browse if you’re curious about any of these topics, but scientists can also leverage these massive datasets to answer specific questions about ecosystem function.


Strategies For Bird Surveys

Mass Audubon has been responsible for NEON’s bird data in New England since the project’s inception. Each year, we send observers (called “field technicians”) to monitor bird numbers and diversity at the Quabbin, as well as Bartlett Forest in New Hampshire.

A diagram showing the layout of bird survey points in a NEON grid. Adapted from Thibault (2015)

Technicians are responsible for surveying a number of randomly selected patches of forest, which are each divided into 3×3 grids of survey points. By standing in one place and counting birds at each evenly spaced point in a grid, the technicians minimize double-counting birds, and get a representative subsample of birds present in each grid.

Even skilled birders won’t detect every bird at a point. To get around this, NEON scientists adjust bird count data with models that account for birds that were present, but undetected by the observer.

Observers are also less likely to detect birds that are far away from them, and more likely to notice birds that are close by. So, field technicians record their distance from each bird with a rangefinder; distant birds are given more “weight” in the model for calculating actual bird abundance. This is based on the assumption that the technician recorded most nearby birds, but missed more that were further away.

Next week, I’ll be posting some entries from my field notebook, and a typical day in the life of a Mass Audubon/NEON bird technician. Stay tuned for some stories from the field.

Part II: Chemical Clues Help Track Migratory Birds


Last week, we posted an article discussing how isotope ratios in a bird’s body vary depending on its past diet and geographic location. Archived in blood and hard tissue, isotopes leave a chemical record of a birds’ life history.


A Golden-winged Warbler on its breeding grounds in New York. Thanks to hydrogen isotope studies, we know this bird likely winters in northern Colombia. (Photo © Will Freedberg)


Isotope analysis has enabled a number of important discoveries about bird biology, including the following:


American Redstarts’ Summertime Breeding Success Depends On Winter Habitat Quality

American Redstarts feed most successfully in wet habitats, although they tolerate and occupy dry habitats as well. A team of Canadian scientists examined redstarts with varying degrees of breeding success, and used carbon isotopes to determine if there was a relationship between a redstart’s wintering grounds and the number of offspring it raised on its breeding grounds.

The ratio of Carbon to its lighter isotope, 13C, varies between wetlands and uplands because of plant metabolism: plants metabolize carbon in one of three ways, and the one most prevalent in wetland plants requires that they store more 13C. This extra 13C accumulates in the bodies of insects that feed on plants, and eventually in the redstarts that feed on insects.

The Canadian team previously showed that redstarts in wet winter habitats had more 13C in their blood cells, enabling them to identify birds on the breeding grounds that had overwintered in wet habitats. The scientists tested birds on the breeding grounds, finding that redstarts that raised more offspring in the summer also had higher concentrations of 13C in their blood, showing that they had occupied better-quality winter habitat.

By showing that wet habitats will do more for redstarts’ reproductive success than dry habitats, this study helps conservationists set priorities for protecting their wintering habitat.  More broadly, this study underscores that not all winter habitat provides what birds need to thrive during the breeding season.


Hydrogen Isotopes Trace Golden-Winged Warblers To Wintering Grounds

 Just as carbon isotopes show if a bird has recently occupied wet or dry areas, hydrogen isotopes help approximate the latitude and elevation of a migrating bird’s origin. A heavy hydrogen isotope, deuterium, occurs in different concentrations depending on climate and weather patterns; its extra mass means it requires more energy than regular hydrogen to evaporate. So, deuterium concentrations in water vary consistently with latitude and elevation, and as birds drink and feed, their bodies build up deuterium concentrations according to their geographic location. This map shows different concentrations of deuterium collected from songbirds across the US:


Adapted from Hobson and Wassenaar (1996). © Springer-Verlag Berlin Heidelberg 1996

Researchers used these patterns to determine if Golden-winged Warblers that bred in similar areas in the US stuck together on their wintering grounds. The Golden-wings’ closest relative, the Blue-winged Warbler, doesn’t do this at all—a bird from Ohio is just as likely to overwinter in Honduras as it is to end up in Mexico. But certain breeding populations of Golden-winged Warbler are in much steeper decline than others, and researchers wondered if it could be because of trouble on their wintering grounds. Deuterium analyses showed that Golden-winged Warblers follow strict migratory routes: birds in Venezuela came almost exclusively from the declining population in the southern Appalachians, while birds in Central America came from the more secure Great Lakes population. These findings suggested that regional differences in population trends might be due to specific threats along migratory routes or on wintering grounds.


Nitrogen Isotopes Reveal Changes In Whip-Poor-Will Diet

A study of nitrogen isotopes In Whip-poor-wills showed that the quality of Whip-poor-wills’ diet has diminished over time, contributing to their decline. A heavy nitrogen isotope, 15N, increases 2-4% with every step in the food chain. As predators consume more prey items, they excrete lighter isotopes and accumulate 15N in their bodies. So, if a Whip-poor-will eats mostly large, predaceous insects, it accumulates 15N faster than a Whip-poor-will eating mostly herbivorous insects—which also tend to be less protein-rich and less nutritious. By analyzing the 15N:14N ratio in the feathers and claws of Whip-poor-will specimens in natural history museums, ornithologists found that the quality of their diet has indeed declined through the past few decades. This study was widely popularized in the news in addition to scientific journals.


Chemical Clues Help Track Migratory Birds (Part I)

Photo © Will Freedberg 2016

Where did this Scarlet Tanager spend the winter? A birder might correctly say “South America,” but where specifically? How can we know the country, the province, the latitude and longitude?

In fact, chemical signatures in feathers, blood, and muscle tissue tell the story of where a bird has been, and what it’s been eating. Over the past couple of decades, ornithologists and chemists have learned how to read into birds’ life histories by analyzing the isotopes that have built up in its body.

What’s An Isotope?

An isotope is just a lighter or heavier-than-normal atom of a given element (like hydrogen, carbon, or nitrogen).

Two kinds of particles contribute to an atom’s mass: protons and neutrons. Most atoms of any element have the same mass because they share the same number of protons and neutrons. While the number of protons in an atom define its identity and properties, adding a neutron to an atom rarely changes its behavior (other than its mass). For example, a bird will suffer no ill effects if a bird’s body contains an abnormal ratio of carbon 13 to carbon 12 (that is, “normal” carbon versus heaviercarbon with an extra neutron).

“You Are What You Eat”

Like any living beings, birds incorporate nutrients from their food into their bodies as they grow. The atoms in these nutrients, some of which will end up in a growing bird’s flesh and blood, exist in different isotopes depending on a variety of factors.  Some isotopes are more common at certain latitudes, or in certain groups of plants, or at a certain level of the food chain. So, a bird’s body will contain different proportions isotopes depending on its location and diet. By analyzing the ratio of one isotope to another in a bird’s body, scientists get an idea of where individual bird is from and what it’s been eating.

Advantages To Isotope Studies: Scale And Cost

Isotopes are particularly useful in long-term or large-scale studies. Isotope analysis ismuch cheaper and often less invasive than attaching geolocators to migratory birds, many of which are too small to carry a transmitter (meaning someone must recapture the bird to recover tracking data).

Studying isotope ratios in natural history museum specimens also provides unique historical perspective on how birds’ diets or ranges have changed over time.

In the next post, we’ll go over a few studies that have used isotopes to track long-term changes in bird diet or established where populations of breeding birds overwinter. Stay tuned!


In Pictures: A Time When Dead Birds Were High Fashion

After Mass Audubon’s founders curtailed the trend of decking out ladies’ hats with entire birds, many bird-adorned fashion items fell into disuse. Local activism made wearing plumes socially unacceptable, and many people donated their avian accessories to Mass Audubon. These donations quickly accrued into a large historical collection.

It’s sobering to imagine how these feathers and hat ornaments were harvested. Take egret plumes, for example, which make up the bulk of Mass Audubon’s collection of hat-related (or “millinery”) items. Because egrets only grow their most extravagant feathers (called “aigrettes”) during a short part of the breeding season, most were shot while on nests. The deaths of their chicks make the millinery trade in birds seem even more wasteful.

Although most activism around the feather trade focused on its impact on America’s avifauna, the Mass Audubon collection includes some surprising and uncommon birds from far-flung locales. For example, this Lesser Bird-of-Paradise head was collected in New Guinea before being attached to a hat, and eventually haphazardly removed:

This Magnificent Riflebird, also from New Guinea, met a similar fate. Only the lower beak and breast feathers remain.

Not everyone who took part in the bird ornament craze could afford the real thing, and many milliners cobbled together cheaper imitations of tropical birds from farmyard feathers- like this hat-topping “parrot” made of pheasant plumes.

Or this cap made from a mishmash of upland game birds:

Some items in the collection have nothing to do with hats. This “feather painting” depicts a parrot, using feathers from the real thing:

Wild bird feathers were also valuable for use as handwarmers, like this ornate muff made from grebe feathers.

For decades, this collection has been housed at Mass Audubon headquarters. It will soon be moved to a more state-of-the-art facility dedicated to housing historical objects and art, where it can be restored and used for research and public education.

You can learn more about Mass Audubon’s founders and the social history of bird conservation by downloading the article “Founding Mothers of Mass Audubon” here.


Partnerships for Plovers: Birdlife International and Mass Audubon

An endangered Piping Plover at one of Mass Audubon’s coastal sanctuaries. (Photo by Will Freedberg)


This year, Mass Audubon is partnering with BirdLife International to help coordinate migratory shorebird conservation across the hemisphere. By joining the Friends across the Flyway initiative, Mass Audubon can link up with conservation organizations along the Atlantic Flyway to protect species shared across borders.


Connectivity Counts

For birds whose ranges cross international borders, it’s crucial that regional conservation groups coordinate with each other. All threatened or endangered shorebirds in Massachusetts spend half the year in migration or at their wintering grounds. Every year, Piping Plovers, Red Knots, and Least Terns migrate to Mexico, the Bahamas, and even Argentina—and they depend on stopover habitats to feed and “refuel” along the way.

Removing just one link in this chain of habitats can spell the demise for an entire population. When making a conservation plan, biologists like to emphasize “habitat connectivity,” or keeping open routes between areas where a species lives. With New England’s shorebirds, this means more than preserving a physical link between protected areas—it means conserving breeding habitat in Massachusetts, wintering habitat in the Southern Hemisphere, and key stopover sites birds use while migrating in between.


How We Help In Massachusetts

Mass Audubon’s Coastal Waterbird Program approaches local shorebird conservation from all possible angles. Firstly, Mass Audubon puts boots on the ground—or rather, on the sand—to monitor shorebird populations and develop science-based conservation plans. Then, we work with local and state governments to put those plans into action. This includes setting goals for shorebird recovery, res-siting energy projects, and helping lawmakers identify beaches where shorebirds are threatened by offroad vehicles.

So far, the program has been a huge success! Piping Plover numbers have quintupled in Massachusetts since the program started in 1984.  American Oystercatchers, once a rare sight in our state, now number over 200 nesting pairs.


Partnerships Save Species

We’re excited that our Coastal Waterbird Program is linking up with BirdLife and its partners! This suite of organizations can pool resources to protect habitat and produce research on these shorebirds’ global needs. To learn more about Friends across the Flyway, check out BirdLife’s video on Rowan, the cute Red Knot.

Throwback Tuesday: Old And New Perspectives On Migration

Spring Migration: The Early Birders’ View

William Brewster, the famous 19th-century ornithologist and Cambridge resident, imagined that spring migrants preferred the rural countryside west of Boston to the woodlands near the city. But when he moved to Concord in 1892, he was surprised to find fewer migrants than he had become used to seeing in Cambridge.

Brewster’s student, Ludlow Griscom, hypothesized that this was the result of birds’ migratory routes. Brewster’s data, collected over decades, seemed to show that migrants did not move evenly across the state, but rather took routes based on the shape of the landscape.

Paraphrased, Griscom’s theory went like this: a big stream of birds passes up the mid-Atlantic coast, and two major contingents form in New York. One, with many inland migrants, would hit the Hudson river valley and follow it north, and the other would travel along the Connecticut coast. A small contingent of birds would then split off and follow the Housatonic River, and a major one would follow the Connecticut River Valley. The rest turn northeast just ahead of Narraganset Bay to avoid the pine barrens of southeastern Massachusetts and Cape Cod. These birds turn north near Boston Harbor, passing through Canton, Milton, Brookline and Cambridge, before continuing north into Essex County and along the New Hampshire coast.

Griscom and Brewster’s theory of migratory routes is roughly illustrated in this map:

Almost, But Not Quite

This particular set of routes has not been borne out by modern data gleaned from the radar. While some studies show that certain areas are regularly “birdier” than others during migration, (including sites along major river valleys), wind and weather patterns ultimately have more sway over bids’ trajectories than the topography of the landscape. Some expert birders still swear that migrating birds following “sight lines” or topographic features, but these observations remains anecdotal.

Even if migratory routes are not as fixed or as specific as Griscom imagined, radar does often show higher concentrations migrants in some areas than others. For example, in early May 2018, birds seemed to avoid southeastern Massachusetts and Boston, staying northwest of I-495. This is demonstrated on the radar maps below (note that the radar station is the white cross in the center of the circle, and that radar can detect birds equally in all directions- check out our blog series on reading radar images if you haven’t yet!)  Bear in mind that these are by no means typical nights—birds take very different migratory paths through Massachusetts every night, mostly depending on wind direction and time of year.

While the radar doesn’t show nocturnal migrants grouping together in narrow ribbons in the air, compiling images like these helps scientists observe patterns in bird migration. For example, this map by Kyle Horton of the Cornell Lab of Ornithology shows the direction in which birds are heading. The length of each bar shows how many birds are flying in that direction over the course of a season. The key takeaway: many birds fly over the ocean from Massachusetts, preferring to take the direct route over the Gulf of Maine rather than follow the coastline.


This map was recently featured in an awesome video by Jackson Childs, a local birder and friend of Mass Audubon. Check out Jackson’s video for more cool information about bird migration, including dawn flight, and some close-up footage of colorful warblers.

If you’ve found surprising patterns in spring migration, let us know in the comments!


Finding Your First Whip-poor-will


Photo by David Larson

A drab bird with a startling call, the Whip-poor-will’s perfect camouflage belies its incredible voice. This nocturnal hunter can broadcast its loud, rhythmic whistle as many as 10,000 times over the course of one night. Wherever Whip-poor-wills live, their sound is as much a part of a summer evening as the familiar chirp of crickets and the whirr of cicadas.

Where’d All The Whip-poor-wills Go?

“Whip-poor-will” is practically a household name. But far more people have heard of them than have actually heard their call. This is no accident—the species has been in trouble since the turn of the 20th century.

Whip-poor-wills’ decline has largely followed the decline of large moths, their favorite food. Recently, a landmark study showed that Whip-poor-wills and other insect-eating birds have been feeding on less and less nutritious prey, as their choices are diminished by pesticide use and habitat destruction.

The Key to Whip-poor-will Habitat

Whip-poor-wills have two main habitat requirements. Firstly, their preference for the largest insects means they require healthy ecosystems that can support Luna moths, Catocala moths, and big grasshoppers. Whip-poor-wills will avoid areas with urban or suburban development, or where pesticide spraying reduces the numbers of large insects. This does not mean that they are averse to open areas—Whip-poor-wills are often found in small agricultural fields, as long as there is little or no chemical disturbance.

Secondly, Whip-poor-wills avoid forests with thick understories and midstory vegetation. While they prefer habitats with some tree cover, they need an open midstory to snatch insects on the wing, and they need bare ground to perch. They are often found in open woodland like pine barrens, as well as small open areas near denser wooded ecosystems—but rarely, if ever, in large tracts of dense thickets.

Sites to Search for Whip-poor-wills

Most places in Massachusetts no longer fit the above criteria with the exceptions of the southeastern and central-west part of the state.

In Plymouth County, try driving the roads of Myles Standish State Forest just after dark.

On Cape Cod, the pine barrens of Wellfleet and Truro often have high densities of Whip-poor-wills; roads through pine barrens between route 6 and the Atlantic beaches are reliable, and even residential roads adjacent to pine barrens can be productive. Crane Wildlife Management Area on the upper cape is also great.

Closer to Boston, you’ll occasionally have luck in the Blue Hills Reservation and on ranger-led programs at Parker River National Wildlife Refuge on Plum Island (which closes at dusk).

Most places around Quabbin Reservoir and the wilder areas of the Connecticut River Valley are excellent for Whip-poor-wills, but few human observers look there at night. If you see a Whip-poor-will out there, report it on eBird, or let us know in the comments!


Predicting Spring Migration: Part 3

(This is the final installment in a series on birding by radar. Read the first and second post first so this one makes sense!)

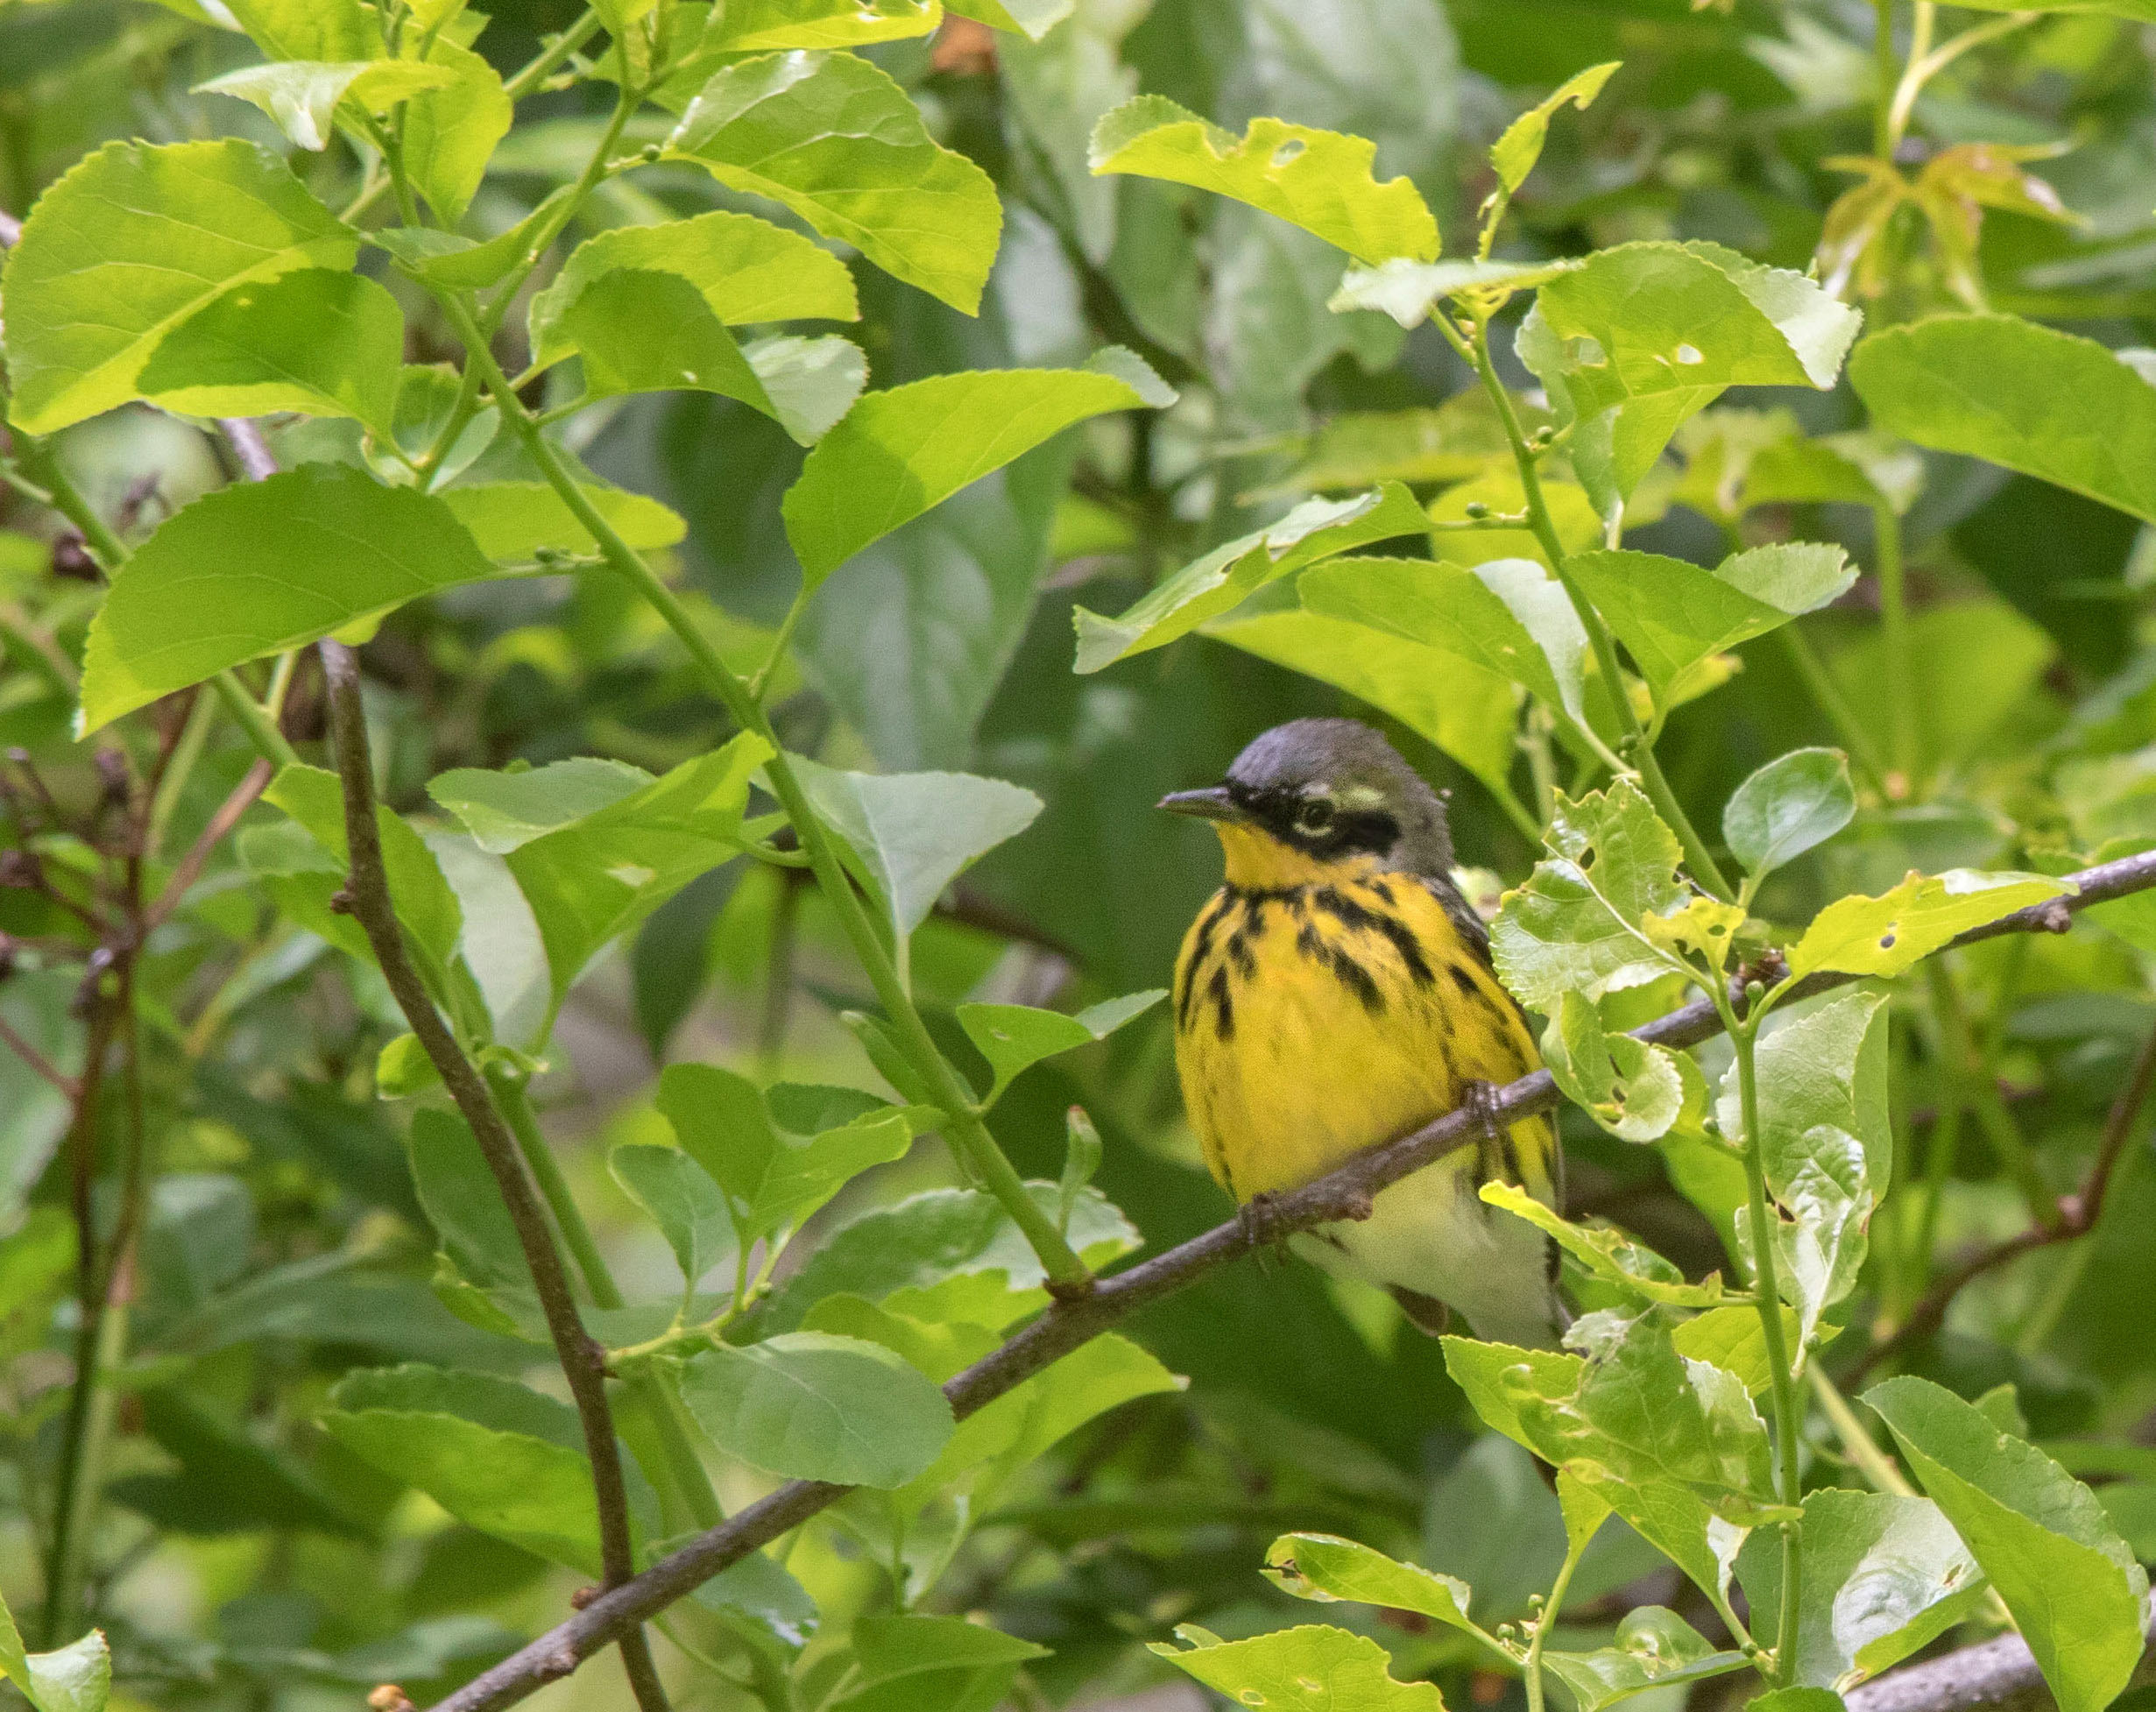
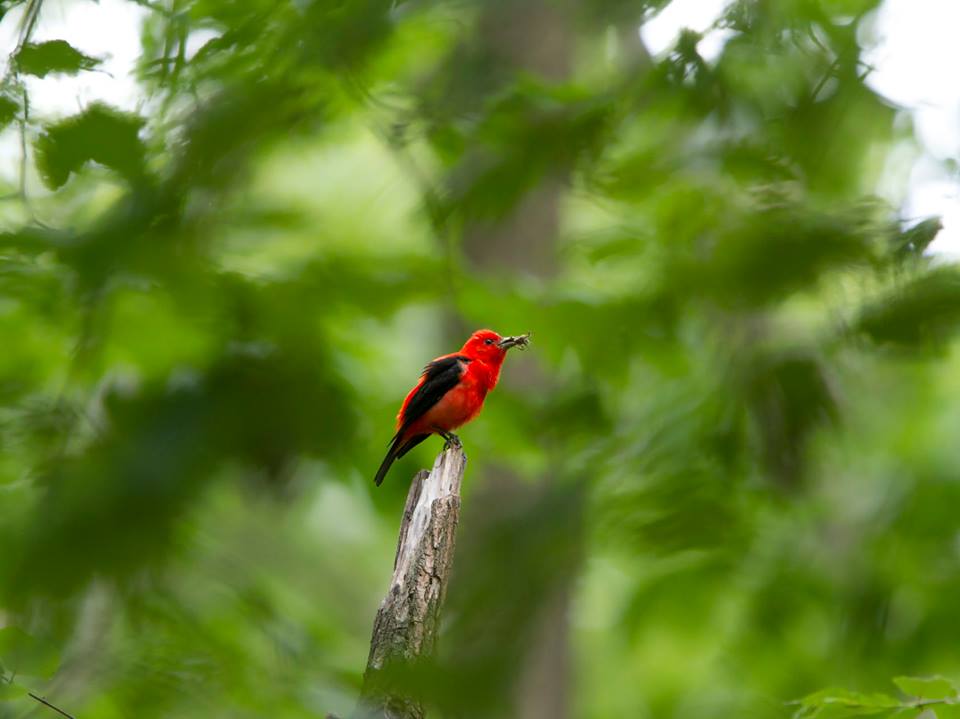
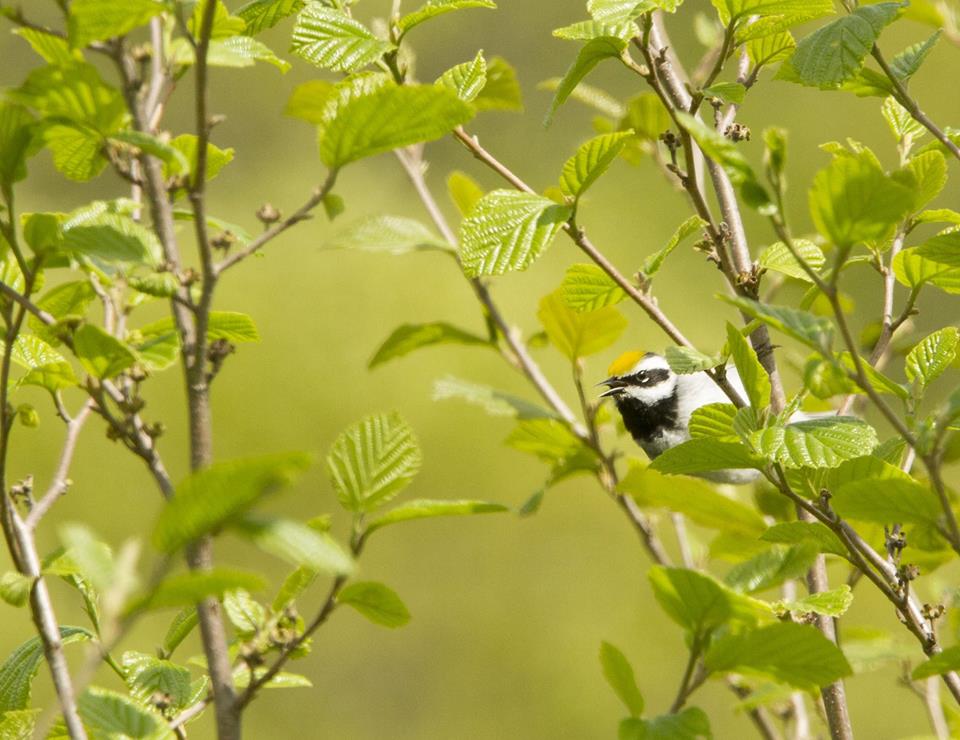
On May 20, 2017, Bay-breasted Warblers seemed to drip from every tree at Mass Audubon’s Marblehead Neck Wildlife Sanctuary. Birders tallied dozens of this normally scarce migrant practically on arrival, alongside equally impressive numbers of Canada Warblers, Blackburnian Warblers, and other migrants. The air filled with high-pitched warbler songs so much that it was difficult to distinguish one from the next. Plum Island was equally loaded, with some observers tallying 123 species for the day. Was this a fallout, or just an excellent day for migration?

Fallout is one of the most exciting spectacles a birder can hope to experience in migration. Serious birders mistakenly use this term all the time to mean “a lot of migrants in one area,” but fallout refers to a very specific phenomenon: birds that cut short their migratory journey due to severe weather or exhaustion.

Birds will fall out along the coast if they are blown far off course over the ocean; they return to land hungry and tired, and large numbers feed at ground-level in coastal vegetation.  Fast-moving fronts of severe weather can also cause fallouts when they interrupt bands of migrating birds, and stationary fronts can stall migrants that land when they encounter it and build up along its edge.

On May 20th, 2017, birders who read the radar saw that northeastern Massachusetts experienced a borderline fallout; a storm had blown birds against the coast and over the ocean, but the weather cleared early enough that many grounded birds continued migrating afterwards. Regardless, the superb birding that day was undeniably predictable.

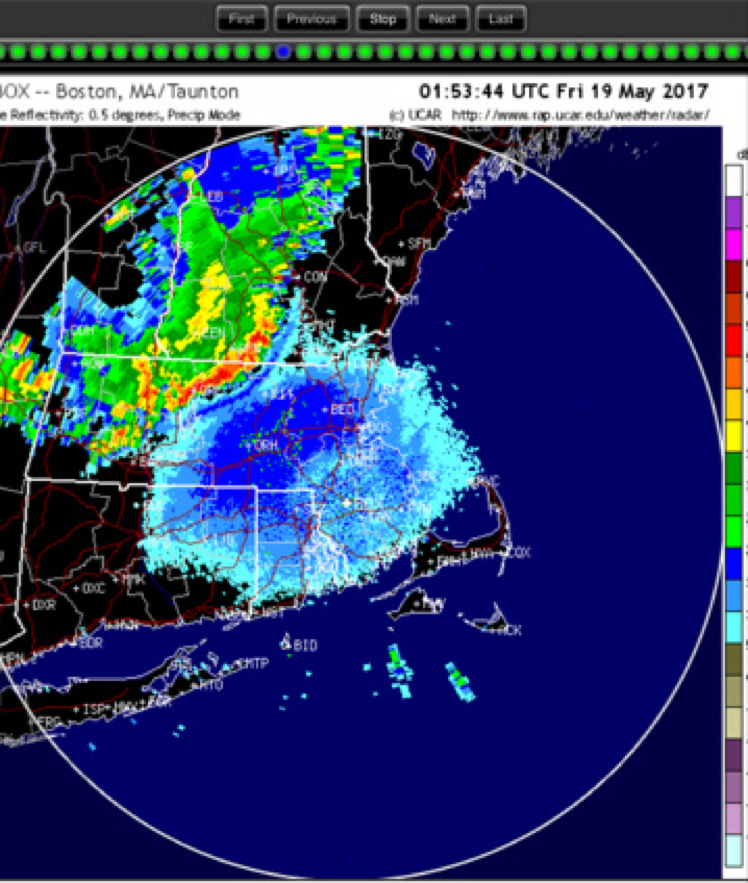
Reading the Radar on May 20, 2017

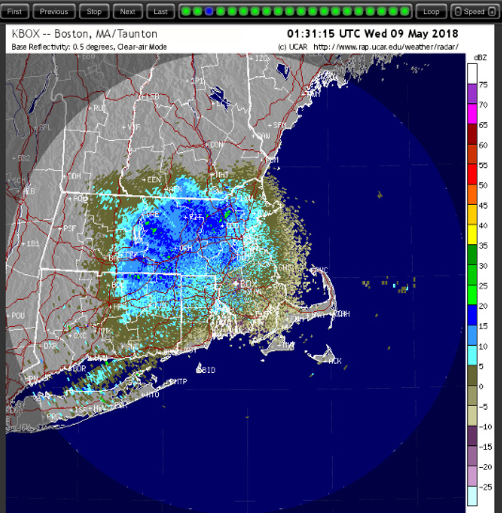
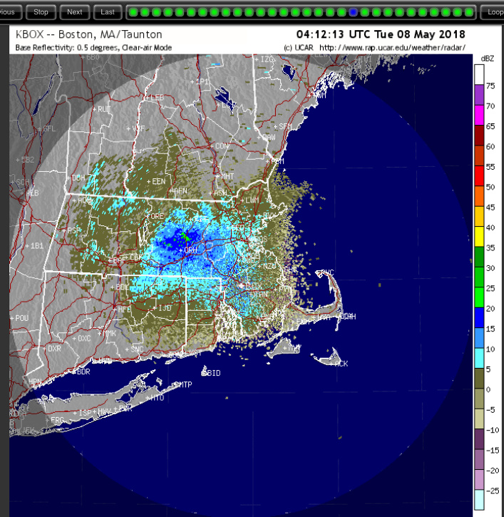
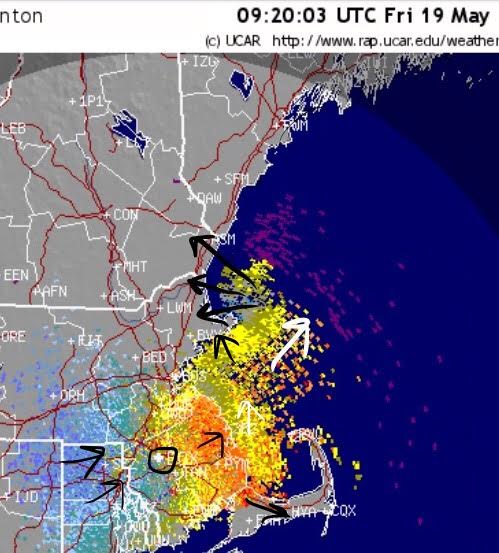
The radar for this night showed moderate migration, with a front of severe weather pushing birds south and east. The dense (green and red) precipitation is pictured up against a group of birds, represented by the blue line between the edge of the storm and the mass of birds in the center of the frame.

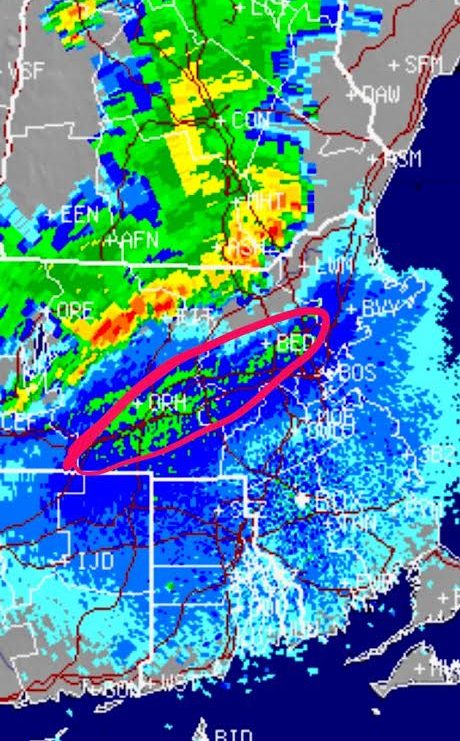
As the front moved east (see below), the density of migrants increased just to its south. The birds at the edge of the storm, pictured in blue above, appear to have been pushed into the main mass of birds, where they show up as a streak of green (higher-density) in the image below.

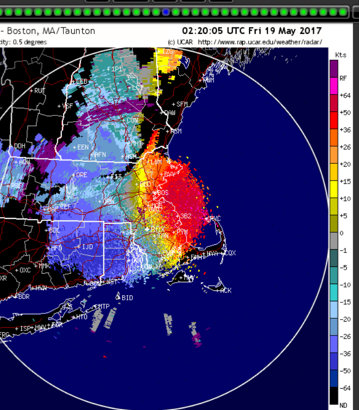
The velocity map below paints a slightly different picture. The black areas between the storm and the birds show that the storm is grounding birds. But the birds just away from the edge—that red spur in New Hampshire, for example—are not getting pushed south by it.

The red color (that is, increased relative velocity reading) of that patch of birds shows that they are either 1) continuing to fly east but increasing their speed or 2) flying north instead of east, as if to go around the storm, and maintaining their speed.  In either case, the fact that these birds are being detected further away from the station than the rest of the cluster indicates that they increased their flying altitude (recall that the further away birds are from the station, the higher they need to be to show up on the radar). It’s anybody’s guess why they would be doing this; the storm exists at a higher altitude than the birds, so flying up into it seems counterintuitive.

What Was Missing

Since the front passed fairly early in the evening, many migrants had a chance to pick themselves up and move along after the storm passed. It is not a reach to imagine that the birds that built up along the edge of the storm took off again after the storm passed, and moved northeast again, landing in similar areas along the Maine coast.

What Looked Promising

Storm or no storm, a forecast of west winds turning northwest at dawn is always a good sign for coastal sites. West winds blow inland migrants against the coast, where many prefer to land instead of flying over the water. Other birds overshoot the coast in strong winds, and when winds turn northwest at dawn, these ambitious flyers drop back in at coastal sites like Plum Island and Marblehead Neck.

The Results

A small but significant stream of birds poured off the ocean and onto the coast in the morning. Some experts say that this was strictly because they were pushed east by the storm, but some hold that these birds would have overshot the coast with the west wind anyway.  In either case, velocity readings from early (4:30-5:30) the next morning show many birds over the ocean colored in yellows, olives, and some blue: birds that are not moving directly away from or directly towards the radar station. In some areas, this means they were moving towards the coast.

Arrows on this map indicating bird direction were determined by drawing a line from the radar station (circled) out to a point with birds, and then drawing an arrow slightly over 90 degrees to this line for birds moving slightly away from the station (yellow).

Likewise, the arrow would be at exactly 90 degrees to the line for birds moving neither towards nor away from the station, slightly under 90 degrees to the line for birds moving slightly towards the station (light blues and greys) and in the direction (or close to it) of the line for birds moving strongly towards or away from the station (colored red or deep blue). If you didn’t follow this, don’t worry: the key is that birds over the water at dawn often means coastal fallout.

To sum it up, there were three elements of that evening’s radar that practically screamed “Go birding on the coast tomorrow”:

  1. Radar showing many birds moving more east than north, and some shooting over the coast at high speed
  2. A strong storm that could force migrants against the coast even more vigorously than the winds could, and might even ground many of them.
  3. Most importantly, birds coming in off the ocean early in the morning (4:30-5:30).

Lo and behold, it was an incredible day on the coast the following morning, even though arguments over how much the early-evening storm had to do with it remain unresolved.

This is just one example of how reading the radar can lead to better birding.  Try it for yourself this spring and see if you strike spring migrant gold!

Predicting Spring Migration: Part 2

Last week, we posted an article on predicting bird movements with radar.  Here’s what we went over:

—How birds show up on Doppler radar as solid, expanding circles of radar interference around radar stations, and why this happens

—How to tell these signals apart from precipitation or normal weather patterns

—How larger circles don’t necessarily mean more birds

This week, winds over Massachusetts are shifting. Steady southwest winds may bring a major influx of migrants as early as Tuesday night. So, here’s the rest of what you’ll need to know about watching birds on Doppler radar!

A Need For (Wind) Speed

it’s possible to see airborne objects’ speed relative to the ground using Doppler radar. Birds fly at about 10-15 knots, and know where they want to go. So, they’ll either be moving 10-15 knots faster than the wind if they’re flying in the same direction as the wind, or they’ll be moving in a different direction entirely. Other airborne objects, like insects or dust particles, will always move with the wind.

Here’s how to see the velocity for radar-detected objects online:

Go to the national website for radar data.

  1. In the top left, click on “0.5° Velocity”. (Selecting “reflectivity” will show you the density of the signal, but not the speed.  Velocity, on the other hand, won’t show you how thick the air is with birds—it will only show their speed).
  2. In the top right, go to the drop-down menu for “end time” to select the end time for the series of radar images you want to view. It’s in Universal Time, which is 4-5 hours ahead of Eastern Standard Time. Selecting “0500” is best if you want to look at last night’s migration, and selecting “most recent” is best if it’s the early nighttime and you want to see what birds are currently passing overhead.
  3. Go to the drop-down menu for “loop duration” and select 5 hours (or however long you want the series of radar images to be).
  4. Click on the letters “BOS” over Eastern Massachusetts to view radar images!

Image modified from the National Center for Atmospheric Research

In radar images, velocity is always measured relative to the radar station.  So, parts of a cluster of birds with “negative” velocity are moving towards the radar station, and parts of a cluster with positive velocity are moving away from it. The red areas in the image show movement away from the radar station (the dark dot drawn in the center of the image), from southwest to northeast. Blue areas show movement towards the radar station—also from southwest to northeast. Birds in the yellow, gray, and green areas are slower-moving relative to the station: as they pass by it, they are neither moving towards it nor away from it.

The wind was about 20kts (knots) from the southwest when this image was taken.  Since this radar signal shows objects moving NE around 35kts, it’s clear they aren’t just drifting with the wind.  These are bona fide birds!

To check wind speed and direction in your area (to compare to clusters of airborne objects on radar maps), try using Wind Map. Just click to zoom, and hover your cursor over Massachusetts to see the wind speed.

Where Will Airborne Migrants Land?

Velocity data can also tell us where birds are going to end up.  Birds usually migrate for between 5-7.5 hours a night, so multiplying their airspeed by around 6 gives us a very rough approximation of how far they’ll travel in one night. On most nights, this works out to be around 150-200 miles. This means that you can often get a general sense of how good the birding will be in Eastern MA based on early-evening images from Southern CT and New York.

For example, when there’s a big early-evening movement of birds over OKX (the radar station for Southern Connecticut and Long Island) and the radar velocity data show birds moving to the east or northeast, chances are that birding will be good in Eastern MA the following morning. If migrants are moving steadily due north, however, that can be a good sign to head further inland the next day.  Of course, it’s always best to check early-morning radar images as well—on some nights with north winds, migrants will pour in from the Atlantic Ocean right before dawn, making for great coastal birding.

In our next post, we’ll discuss radar images from the night before the best day of spring migration in 2017. It should serve as a case study in how watching the weather and radar can lead to encounters with incredible concentrations of migratory songbirds. Stay tuned!