This summer, I’ve been surveying birds at the Quabbin Reservoir for Mass Audubon and NEON, the National Ecological Observatory Network. The deep forests and hollows of the Quabbin watershed host scarce breeders like Cerulean and Canada Warbler, along with most common woodland breeders in the state. The Quabbin’s size and diversity of intact habitats make it an ideal study site for a program like NEON.
NEON is an exciting project because of its scale. Funded by the National Science Foundation, the network comprises more than 80 sites across the country’s 20 ecoregions. At each site, NEON coordinates teams of scientists to keep tabs on a variety of ecological indicators. These include large-scale factors like water chemistry, greenhouse gasses, and tree cover, as well as narrower topics like fish DNA, bird diversity, and disease prevalence in ticks, mice and mosquitoes.
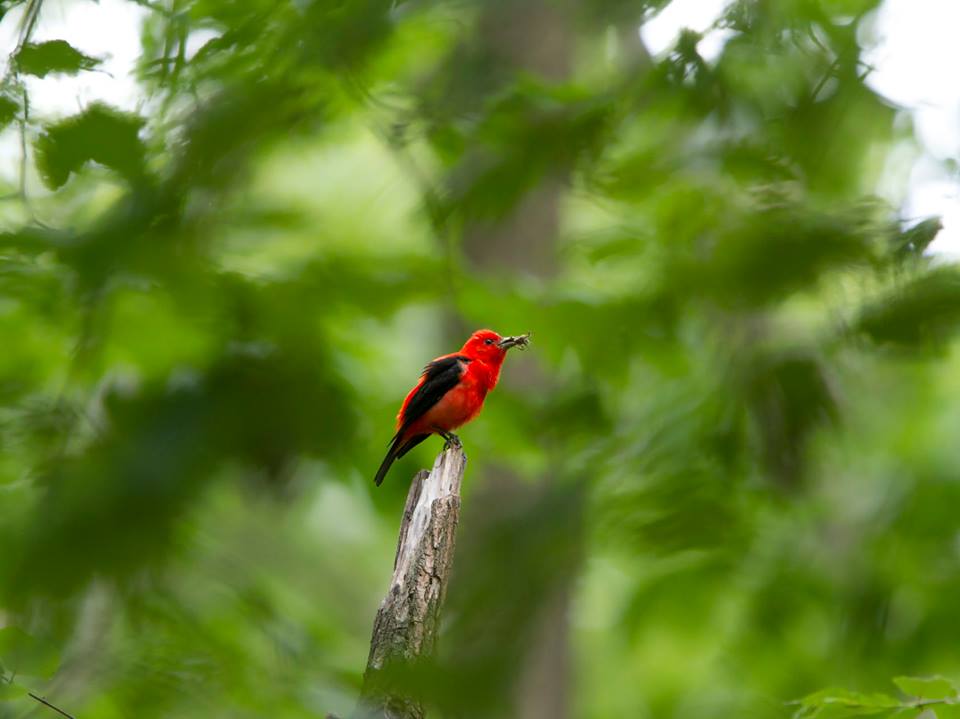
A Scarlet Tanager with insect prey, perched on a snag by the Quabbin. Photo by Will Freedberg.
NEON treats birds as one piece of a vast puzzle: by studying how long-term ecological trends line up with each other, the project aims to parse out the causes and consequences of environmental change.
Most importantly, all NEON data is free and publicly available. It’s fun to browse if you’re curious about any of these topics, but scientists can also leverage these massive datasets to answer specific questions about ecosystem function.
Strategies For Bird Surveys
Mass Audubon has been responsible for NEON’s bird data in New England since the project’s inception. Each year, we send observers (called “field technicians”) to monitor bird numbers and diversity at the Quabbin, as well as Bartlett Forest in New Hampshire.
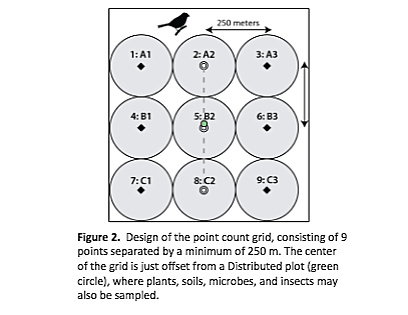
A diagram showing the layout of bird survey points in a NEON grid. Adapted from Thibault (2015)
Technicians are responsible for surveying a number of randomly selected patches of forest, which are each divided into 3×3 grids of survey points. By standing in one place and counting birds at each evenly spaced point in a grid, the technicians minimize double-counting birds, and get a representative subsample of birds present in each grid.
Even skilled birders won’t detect every bird at a point. To get around this, NEON scientists adjust bird count data with models that account for birds that were present, but undetected by the observer.
Observers are also less likely to detect birds that are far away from them, and more likely to notice birds that are close by. So, field technicians record their distance from each bird with a rangefinder; distant birds are given more “weight” in the model for calculating actual bird abundance. This is based on the assumption that the technician recorded most nearby birds, but missed more that were further away.
Next week, I’ll be posting some entries from my field notebook, and a typical day in the life of a Mass Audubon/NEON bird technician. Stay tuned for some stories from the field.