Last week, we posted an article on predicting bird movements with radar. Here’s what we went over:
—How birds show up on Doppler radar as solid, expanding circles of radar interference around radar stations, and why this happens
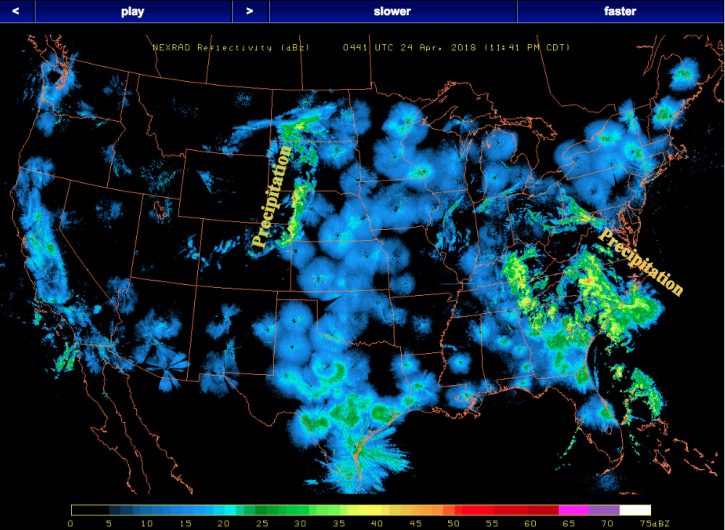
—How to tell these signals apart from precipitation or normal weather patterns
—How larger circles don’t necessarily mean more birds
This week, winds over Massachusetts are shifting. Steady southwest winds may bring a major influx of migrants as early as Tuesday night. So, here’s the rest of what you’ll need to know about watching birds on Doppler radar!
A Need For (Wind) Speed
it’s possible to see airborne objects’ speed relative to the ground using Doppler radar. Birds fly at about 10-15 knots, and know where they want to go. So, they’ll either be moving 10-15 knots faster than the wind if they’re flying in the same direction as the wind, or they’ll be moving in a different direction entirely. Other airborne objects, like insects or dust particles, will always move with the wind.
Here’s how to see the velocity for radar-detected objects online:
Go to the national website for radar data.
- In the top left, click on “0.5° Velocity”. (Selecting “reflectivity” will show you the density of the signal, but not the speed. Velocity, on the other hand, won’t show you how thick the air is with birds—it will only show their speed).
- In the top right, go to the drop-down menu for “end time” to select the end time for the series of radar images you want to view. It’s in Universal Time, which is 4-5 hours ahead of Eastern Standard Time. Selecting “0500” is best if you want to look at last night’s migration, and selecting “most recent” is best if it’s the early nighttime and you want to see what birds are currently passing overhead.
- Go to the drop-down menu for “loop duration” and select 5 hours (or however long you want the series of radar images to be).
- Click on the letters “BOS” over Eastern Massachusetts to view radar images!
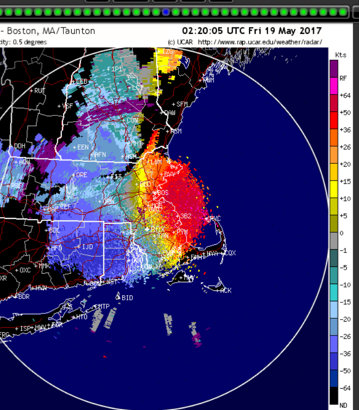
Image modified from the National Center for Atmospheric Research
In radar images, velocity is always measured relative to the radar station. So, parts of a cluster of birds with “negative” velocity are moving towards the radar station, and parts of a cluster with positive velocity are moving away from it. The red areas in the image show movement away from the radar station (the dark dot drawn in the center of the image), from southwest to northeast. Blue areas show movement towards the radar station—also from southwest to northeast. Birds in the yellow, gray, and green areas are slower-moving relative to the station: as they pass by it, they are neither moving towards it nor away from it.
The wind was about 20kts (knots) from the southwest when this image was taken. Since this radar signal shows objects moving NE around 35kts, it’s clear they aren’t just drifting with the wind. These are bona fide birds!
To check wind speed and direction in your area (to compare to clusters of airborne objects on radar maps), try using Wind Map. Just click to zoom, and hover your cursor over Massachusetts to see the wind speed.
Where Will Airborne Migrants Land?
Velocity data can also tell us where birds are going to end up. Birds usually migrate for between 5-7.5 hours a night, so multiplying their airspeed by around 6 gives us a very rough approximation of how far they’ll travel in one night. On most nights, this works out to be around 150-200 miles. This means that you can often get a general sense of how good the birding will be in Eastern MA based on early-evening images from Southern CT and New York.
For example, when there’s a big early-evening movement of birds over OKX (the radar station for Southern Connecticut and Long Island) and the radar velocity data show birds moving to the east or northeast, chances are that birding will be good in Eastern MA the following morning. If migrants are moving steadily due north, however, that can be a good sign to head further inland the next day. Of course, it’s always best to check early-morning radar images as well—on some nights with north winds, migrants will pour in from the Atlantic Ocean right before dawn, making for great coastal birding.
In our next post, we’ll discuss radar images from the night before the best day of spring migration in 2017. It should serve as a case study in how watching the weather and radar can lead to encounters with incredible concentrations of migratory songbirds. Stay tuned!