When conducting research at Wellfleet Bay, a lot goes on between the early stages of brainstorming research questions and compiling study results.
As reported in previous posts, we’ve been conducting a three-year study of horseshoe crab movements in Wellfleet Harbor as part of our ongoing effort to get a better understanding of the declining population in Wellfleet Harbor. The project has just wrapped up its data collection phase. But downloading and compiling the data from all 20 acoustic receivers in the harbor is much easier said than done!
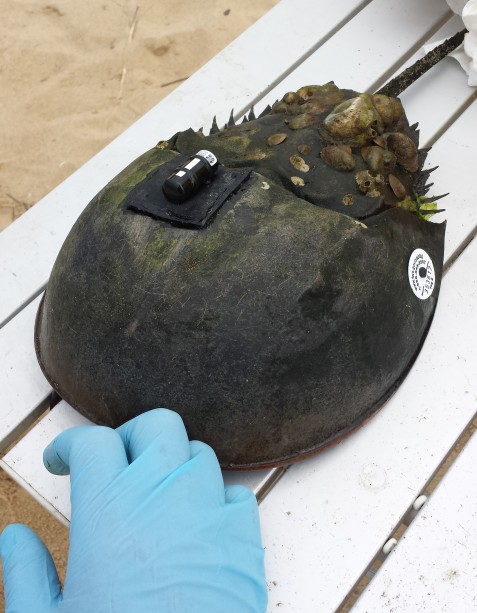
Horseshoe crab with acoustic tag, courtesy of Mike Long
Acoustic telemetry is a technology which allows aquatic species to be monitored and tracked without having to be actually seen by researchers. Transmitters are attached to the outside or implanted into an animal and receivers are deployed in the water at known fixed locations. The transmitters, or tags, emit detailed sonic signals which can be detected and decoded by nearby receivers to identify individual animals. When compiled, these detections can give records of where an animal was and when it was there, often over periods of time which can span several years.
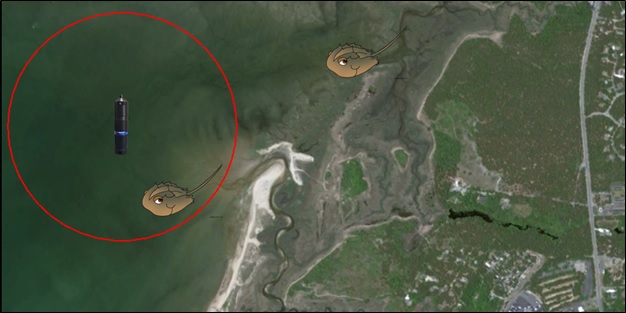
A view above Wellfleet Bay. The red circle around the receiver represents the detection range of a receiver. Detection ranges can vary from less than 100 meters to over 1500 meters based on a variety of environmental conditions. A signal from the transmitter of the crab inside the red circle would be detected by the receiver, but not a signal outside.
Before any data could be collected, we needed to purchase and prepare equipment, obtain permits, plan for gear deployment, and check the marine forecast for a day with weather decent enough to get on the water.
Once receivers were in the water and crabs were tagged, data downloads took place roughly every month to update detection records and check equipment to make sure everything was functioning properly.
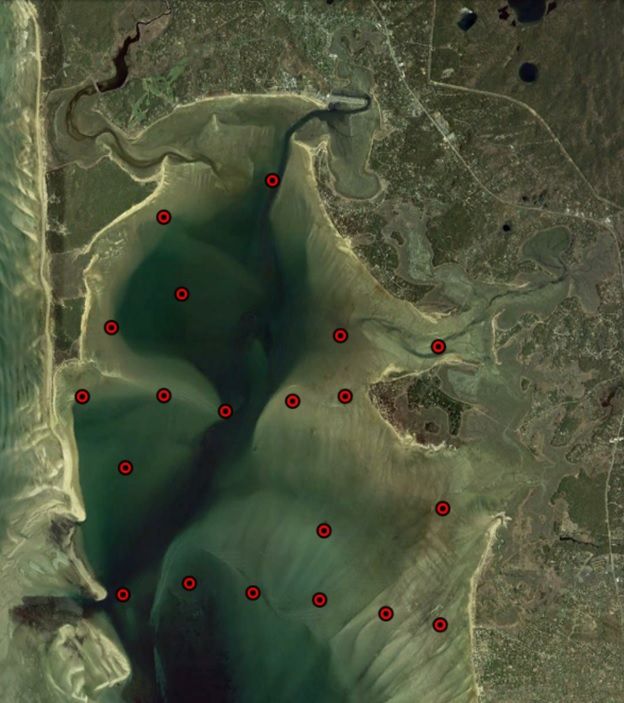
This map of Wellfleet Harbor shows the locations of our 20 fixed receivers distributed throughout the harbor.
Unlike satellite tags, which are another common technology used to track aquatic animals in real time, acoustic receivers store their detections internally and they must be downloaded manually. For us, this meant borrowing a boat and getting out on the water.
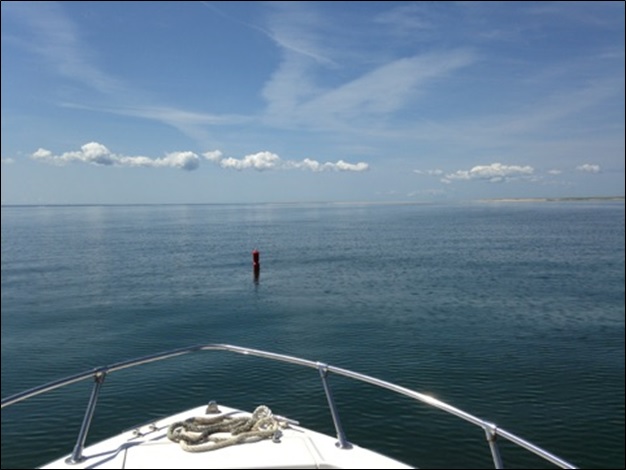
An orange receiver buoy floating in Wellfleet Harbor on a calm day. Obviously, flat ocean conditions like this make data downloads much easier than on windy and choppy days.
Data downloads are done by motoring up to each of our 20 individual receiver station floats, hauling them on board and temporarily tying them off to a boat cleat, cleaning off all the biofouling (including algae, shellfish, crustaceans, barnacles, and many other marine invertebrates) which covers the receivers and float poles, and connecting to each receiver via Bluetooth. A small magnetic key is inserted into the receiver to activate a Bluetooth signal, and a tablet then connects to the receiver. Our Vemco brand receivers come with their own software, called VUE, to facilitate the actual data download process.
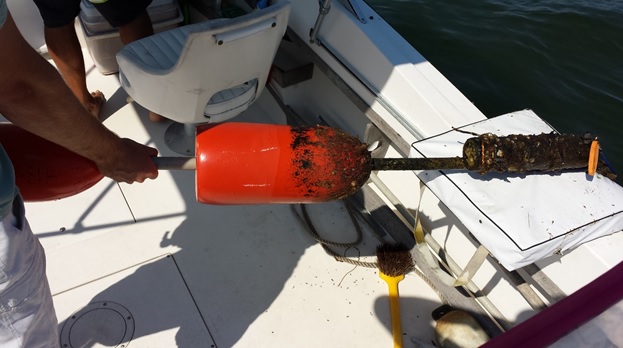
A close up look at one of our receiver float poles. The receiver is hose-clamped onto the bottom of a PVC pole and two orange floats at the top of the pole mark its location in the harbor. The small orange float at the bottom of the receiver (at far right) is the magnetic key inserted into the receiver during a data download.
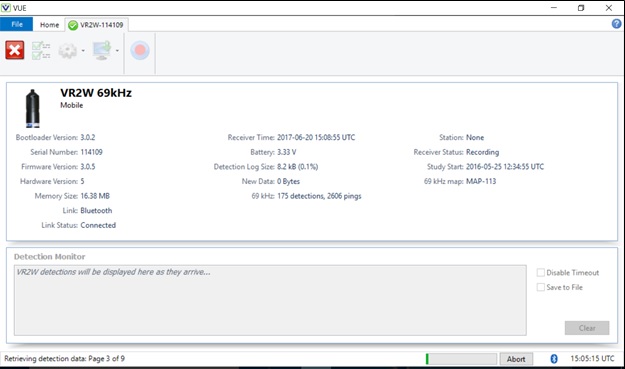
A screenshot of Vemco’s VUE software during an active download. The large grey box on the bottom of the screen will show the 5 most recent detections on that receiver, which is the first glimpse into new data while we are on the water.
Once all receivers have been downloaded on the water, the data is brought into one large database that contains all data from the project. The data can be broken down to look at individual tags, stations, or time periods. Vemco’s VUE software can also give visual representations of the data, which can also be broken down to look at specific individual tags, stations, or time periods as well.
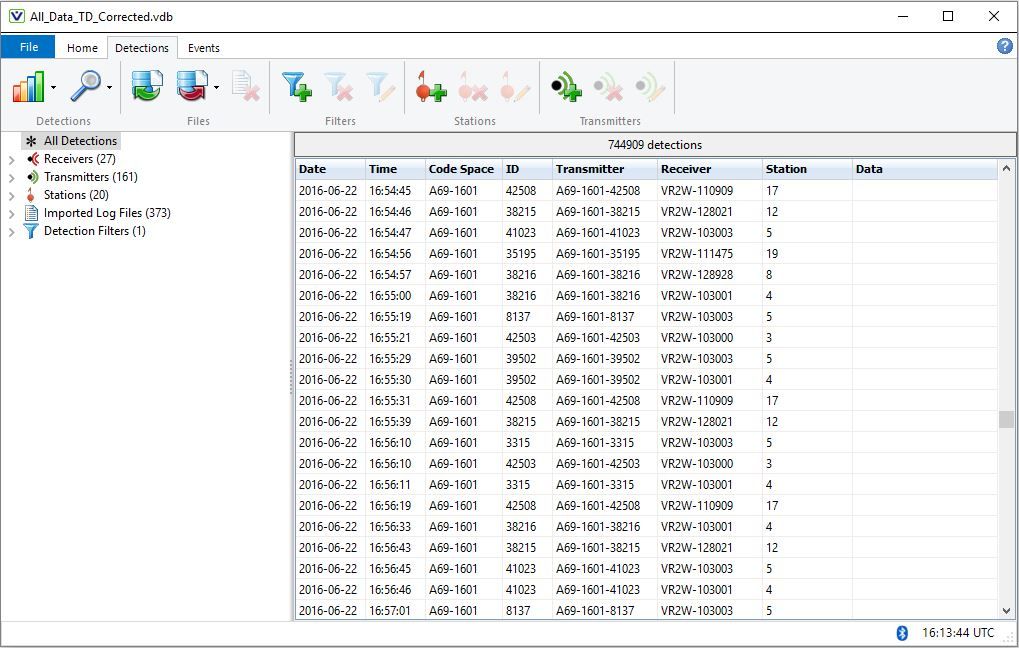
A screenshot of the full database in Vemco’s VUE software. This quick snapshot shows detections through the course of just over 2 minutes, but there were 8 crabs detected on 7 stations in that time period. Tag IDs with 35xxx are 2015 tags and all other tag IDs are from 2016. Look at that total detection number at the top, almost 750,000 detections!
The graph below shows all the data for one crab that was tagged with transmitter A69-1601-35185. Each row on the Y axis (the vertical one) represents a different station that the crab was detected on, and as you move left to right on the X axis you are moving through time from the spring of 2015 to the spring of 2016. When you pair this graph with the map of receiver station locations, you can visualize the crab moving around the harbor over time.
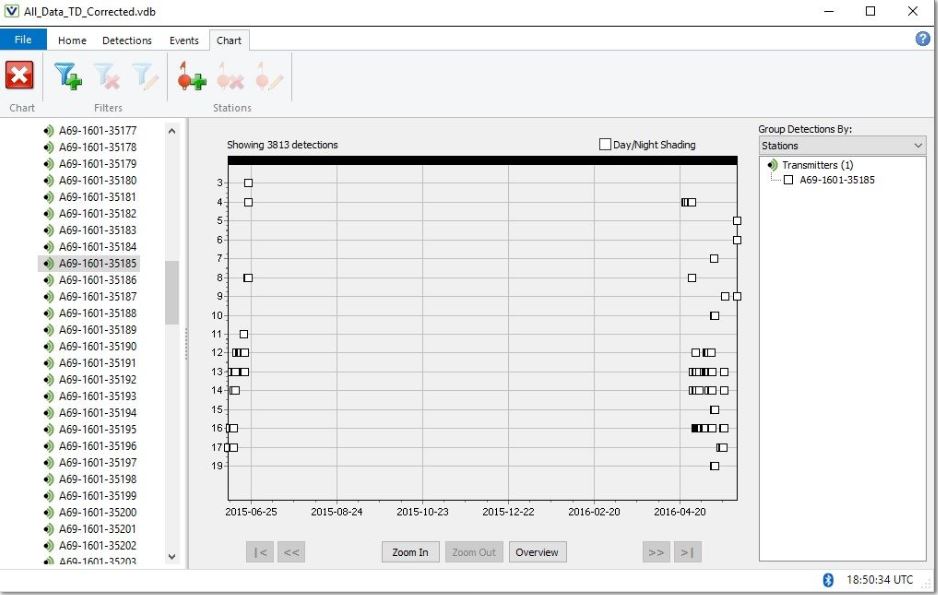
A screenshot of the graphical data representation in Vemco’s VUE software. This graph shows all the data for one crab that was tagged with transmitter A69-1601-35185.
This crab, whose movements are displayed in the graph above, was tagged in early June of 2015 in Blackfish Creek with the first detections at station 17, and then moved around the harbor a bit before leaving at the end of June with the last detection on station 4 at the southern edge of the harbor. It was not detected again until the spring of 2016. The crab came back into the harbor in April of 2016 at station 4 before taking a tour of the harbor all the way up to Great Island on station 19. It finally turned around and left the harbor in early June of 2016 with its last detection at station 5.
The data from this telemetry project has given detailed spatial ecology information on horseshoe crabs in our small Outer Cape embayment that we call home at Wellfleet Bay. Monitoring movement patterns of crabs as they migrate back and forth between Wellfleet Harbor and Cape Cod Bay can provide insight into how much overlap and mixing there is between populations of crabs in the two geographic areas. This project will hopefully lead to better informed management decisions for horseshoe crab harvest in the state.
A huge thank to Mass Audubon volunteer Nick Picariello and all staff in the Wellfleet Harbormaster’s office as they have helped deploy our receivers and taken our staff out for countless data downloads over the past three years of our horseshoe crab acoustic telemetry project. Sorry for always getting your boats covered in algae and all other types or marine life! We would also like to acknowledge the Max and Victoria Dreyfus Foundation, Inc. and the Massachusetts Environmental Trust which provided the funding for our horseshoe crab acoustic telemetry project.
This post was contributed by Wellfleet Bay horseshoe crab researcher Mike Long, who conducted the study as part of his work towards a master’s degree at the University of Massachusetts, Amherst. Mike will be presenting the results of his study on Saturday, November 4th at the State of Wellfleet Harbor Conference.
Hi really very nice post You’ve made some really good points there. I checked on the internet for additional information about the issue and found most people will go along with your views on this web site. keep posting ahead.